A graph of dependencies among targets in a CMake project can be quite complex. For example, a graph of targets in CMake itself looks like this:
git clone https://gitlab.kitware.com/cmake/cmake.git
cmake -S . --graphviz=cmake_targets.dot
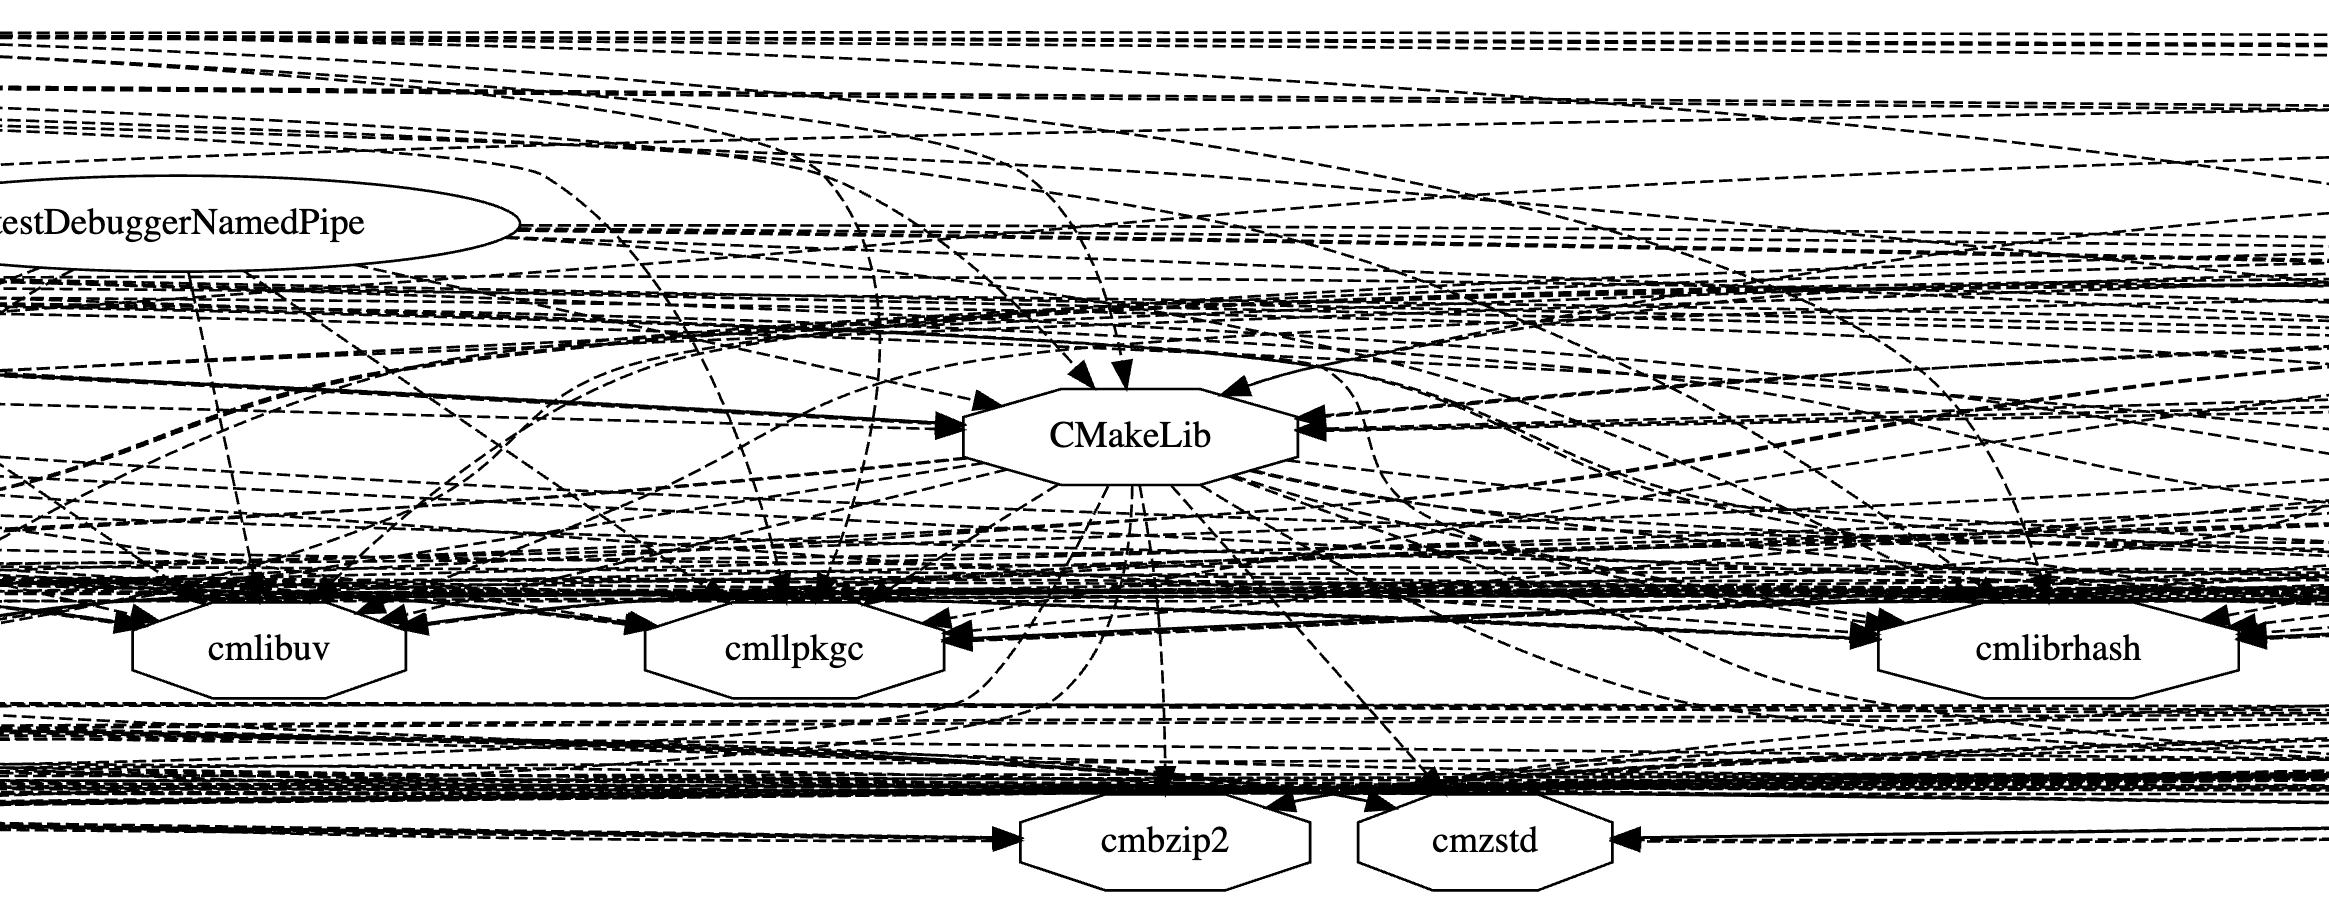
In this case, the graph is complex because
there is a cluster of 16 targets that are used by 17 others.
There are simply too many edges that connect all-to-all
in this group of targets.
Now the cmake_graph_tests
project includes a simple clustering algorithm,
implemented in DepCluster class,
find_cluster and find_all_clusters functions.
The clusters look like the following in CMake:
cmake_graph graph -B cmake/build \
  --skip-types UTILITY \
  --frequent-deps-threshold 3
A graph of rocksdb without test targets turns out manageable too:
cmake_graph graph -B rocksdb/build \
  --skip-types UTILITY \
  --skip-names "rocksdb_check|.*test.*" \
  --frequent-deps-threshold 3
I also tried to make a graph of Abseil targets.
It still looks too busy to be useful.
Of course, a bunch of --skip-names filters
could carve out a manageable sub-graph.
But I want to look at the full project a bit more,
to try to figure out whether something could make the graph more readable,
while retaining all the information.
It would be a good milestone, to graph Abseil.
Aside of that, the current plan is to make more of these graphs on practice, in order to understand what this tool should do.
Then, it’s probably worth to rewrite it later, and aim at making a VS Code extension. It may be worth to rewrite the tool as a library in Dart, to easily deploy in CLI, GUI and Javascript.